
Vizura - Statistical Analysis and Visualization Tool
Vizura is a data analysis and visualization Package developed using Python, Plotly and Streamlit. It provides valuable insights into datasets by generating summary statistics and offering interactive visualizations.
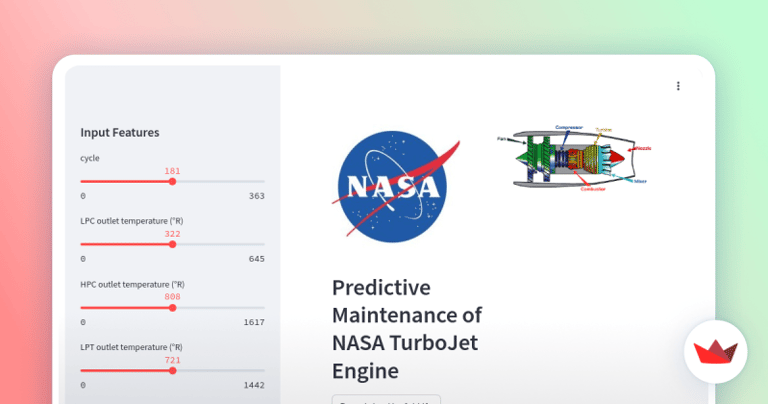
Predictive Maintenance
Predictive maintenance for NASA's aircraft turbo engines, using XGBoost and Random Forest to predict remaining operational cycles before failure, achieving an accuracy of approximately 76%. Utilizes multivariate sensor data and is deployed using Docker with an interactive Streamlit app for predictions.


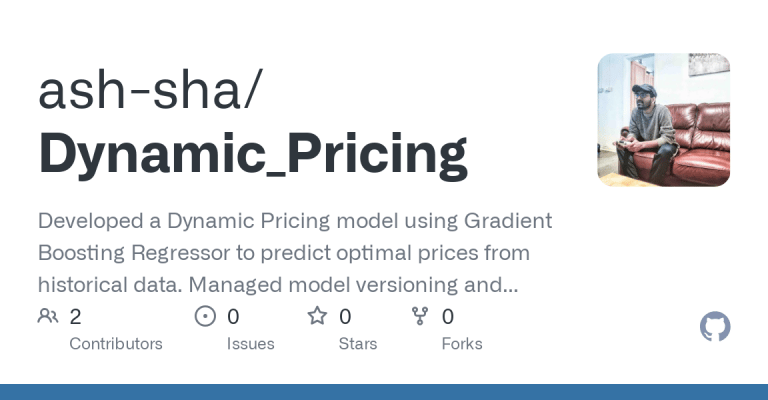

Dynamic Pricing
Dynamic Pricing model using Gradient Boosting Regressor to predict optimal prices from historical data. Model versioning and deployment with MLflow, integrating batch and real-time inference pipelines. GitHub Actions for CI/CD, automating model training, logging, and updates for seamless predictions.
Machine Learning and Analytics
Cancer Prediction
New Feature Selection Process to Enhance Naïve Bayes Classification project concentrates on improving the classification accuracy of cancer cells using gene microarray as features for colon, lymphoma and leukemia, using Naïve Bayes, along with Point wise mutual information (PMIGS) as feature selection technique.
Performance of Classification Algo - Case Study
A comparative study to evaluate the performance of different classification and clustering algorithms on a Dataset of Adult Population and the effect of Preprocessing in the efficiency of the algorithm.


and few..
Since November 2020 till July 2024, I participated in virtual programs with Forage, collaborating with General Electric, ANZ Bank, Quantium Analytics, KPMG, JP Morgan & Chase, and PwC. I analyzed supermarket and bank transaction datasets, uncovering insights through Tableau and PowerBI, while applying machine learning models to address supply chain challenges. Additionally, I conducted statistical tests, identified purchasing behaviors, and created client-focused KPIs.